Excel / Google Sheets Template
Project Health Command Center
A free Excel & Google Sheets dashboard that automatically scores your project's health across 10 weighted dimensions, flags your top attention areas, and rolls it all into a live executive dashboard — no setup, no formulas to build.
Free
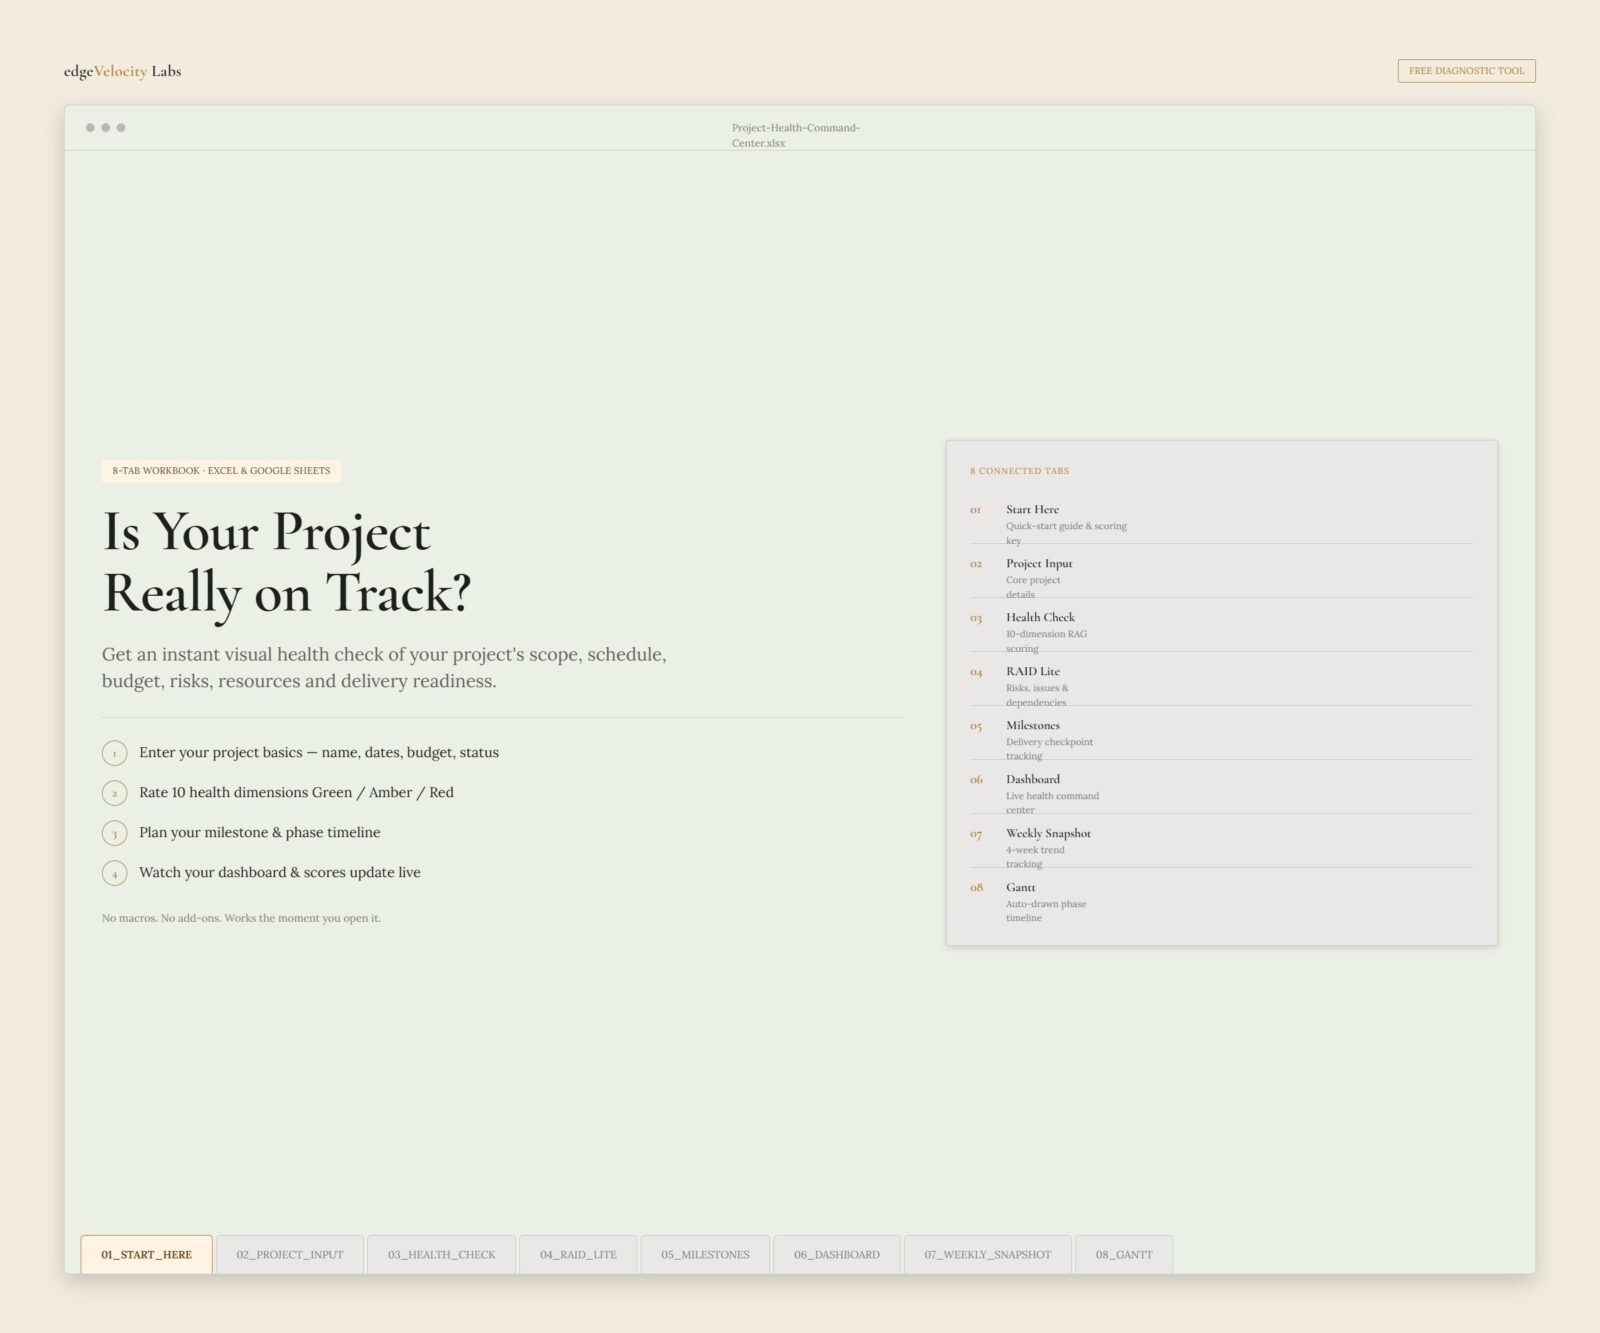
Is Your Project Really on Track?
Most project trackers just list tasks and dates. The Project Health Command Center tells you the truth: an automatic, weighted health score across 10 dimensions of your project — so you know exactly where things stand before your stakeholders ask.
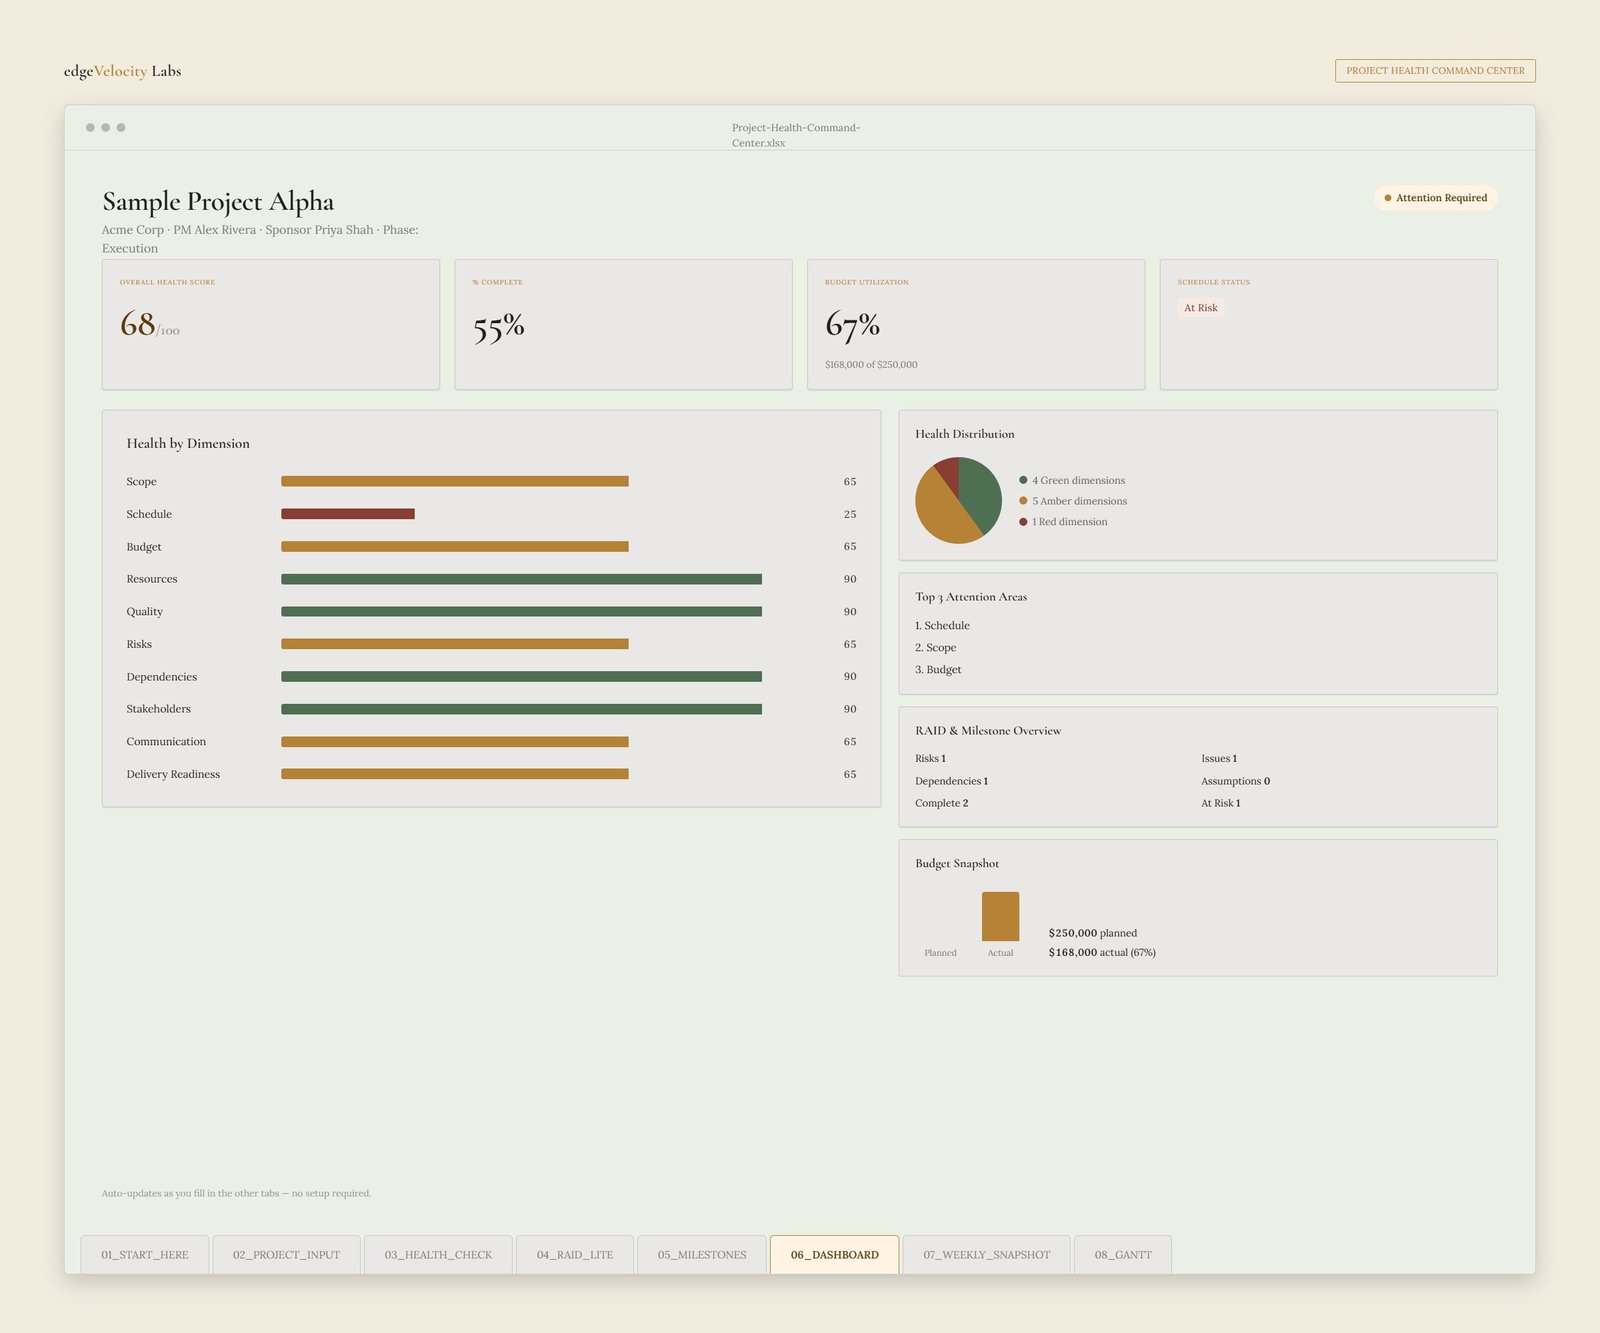
Rate each dimension Green, Amber, or Red, and the workbook does the rest — calculating your Overall Health Score (0–100), your RAG status, and your Top 3 Attention Areas automatically. Everything rolls up into a live executive dashboard with 5 charts, updating instantly as you fill in the other tabs.
Built for project managers, small business owners, and anyone running a project who wants real visibility without the cost or learning curve of enterprise PM software.
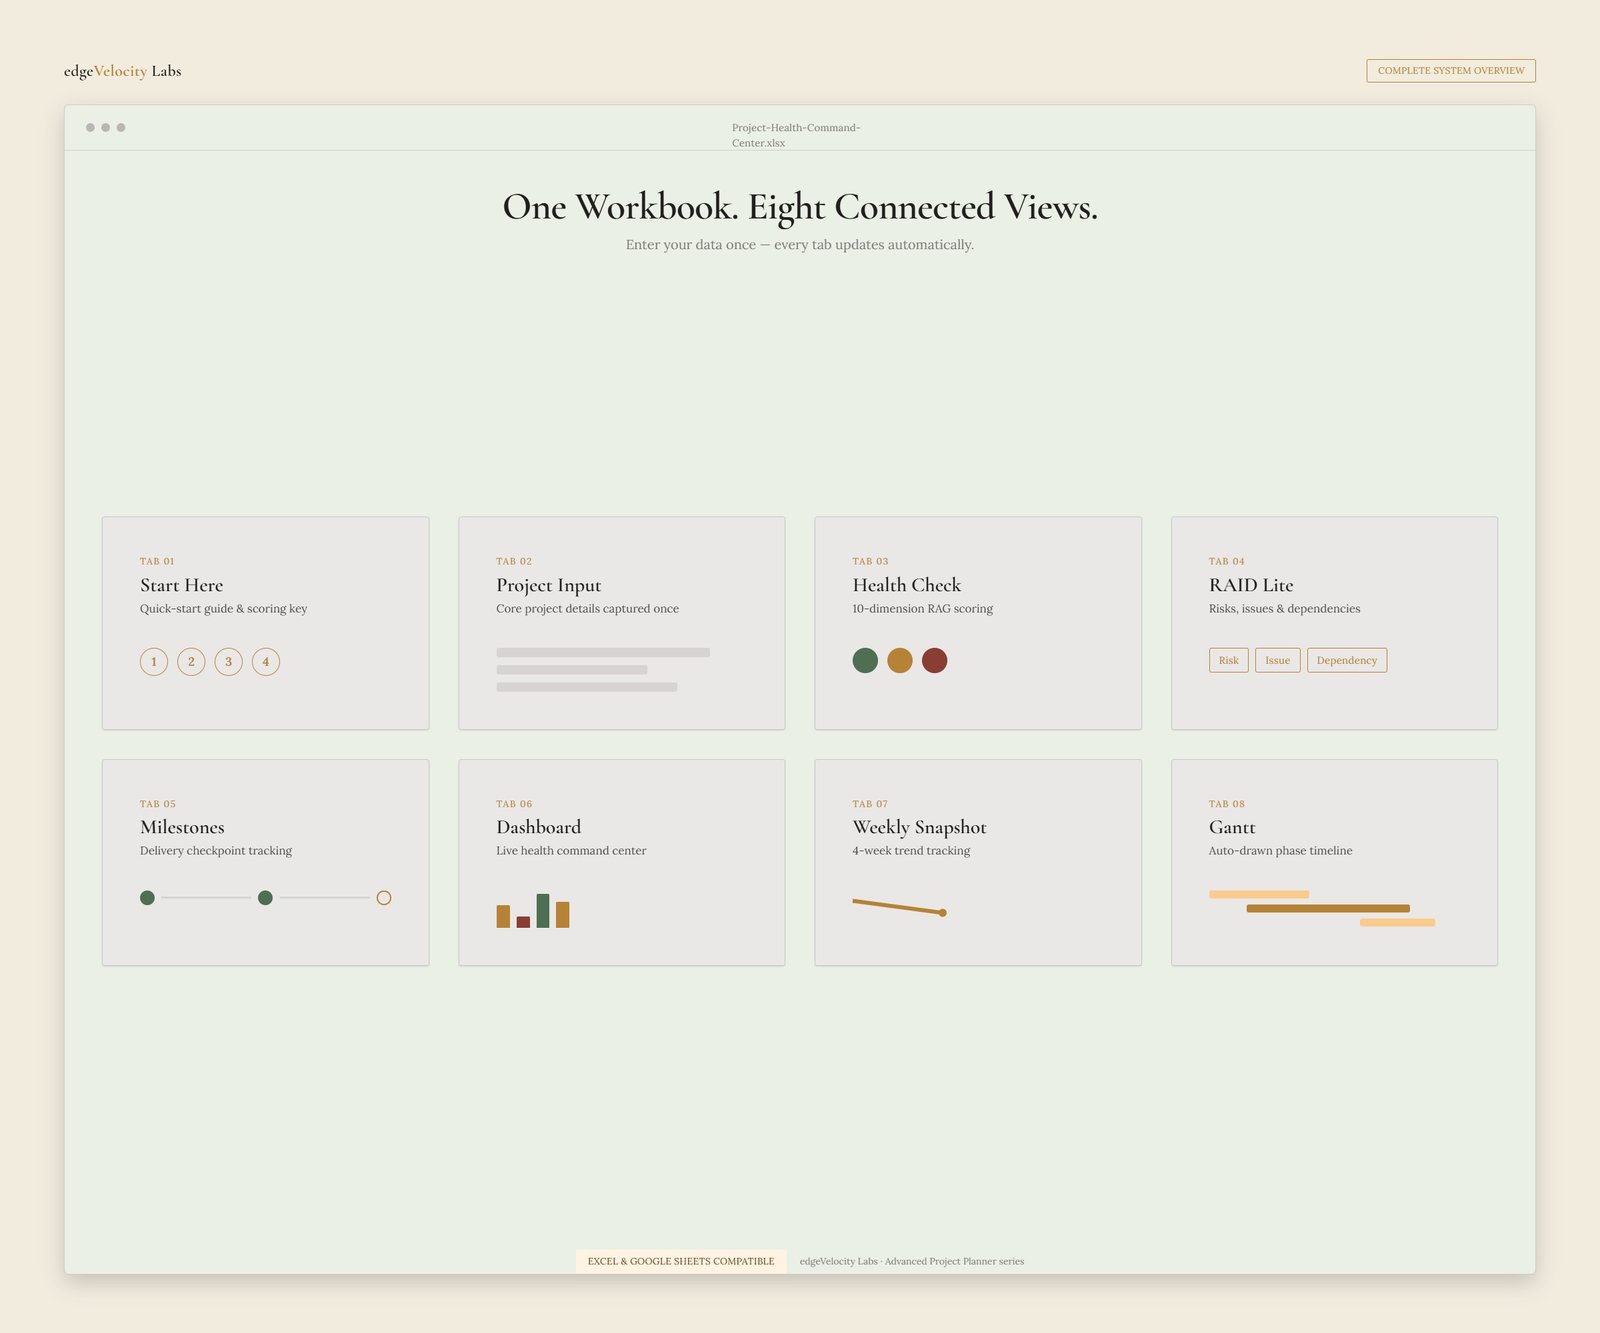
What’s inside (8 tabs)
- 01 Start Here — a 3-step quick-start guide plus the scoring-band legend, so you’re productive in your first minute.
- 02 Project Input — the basics (project name, dates, budget, % complete, status) that feed every other tab automatically.
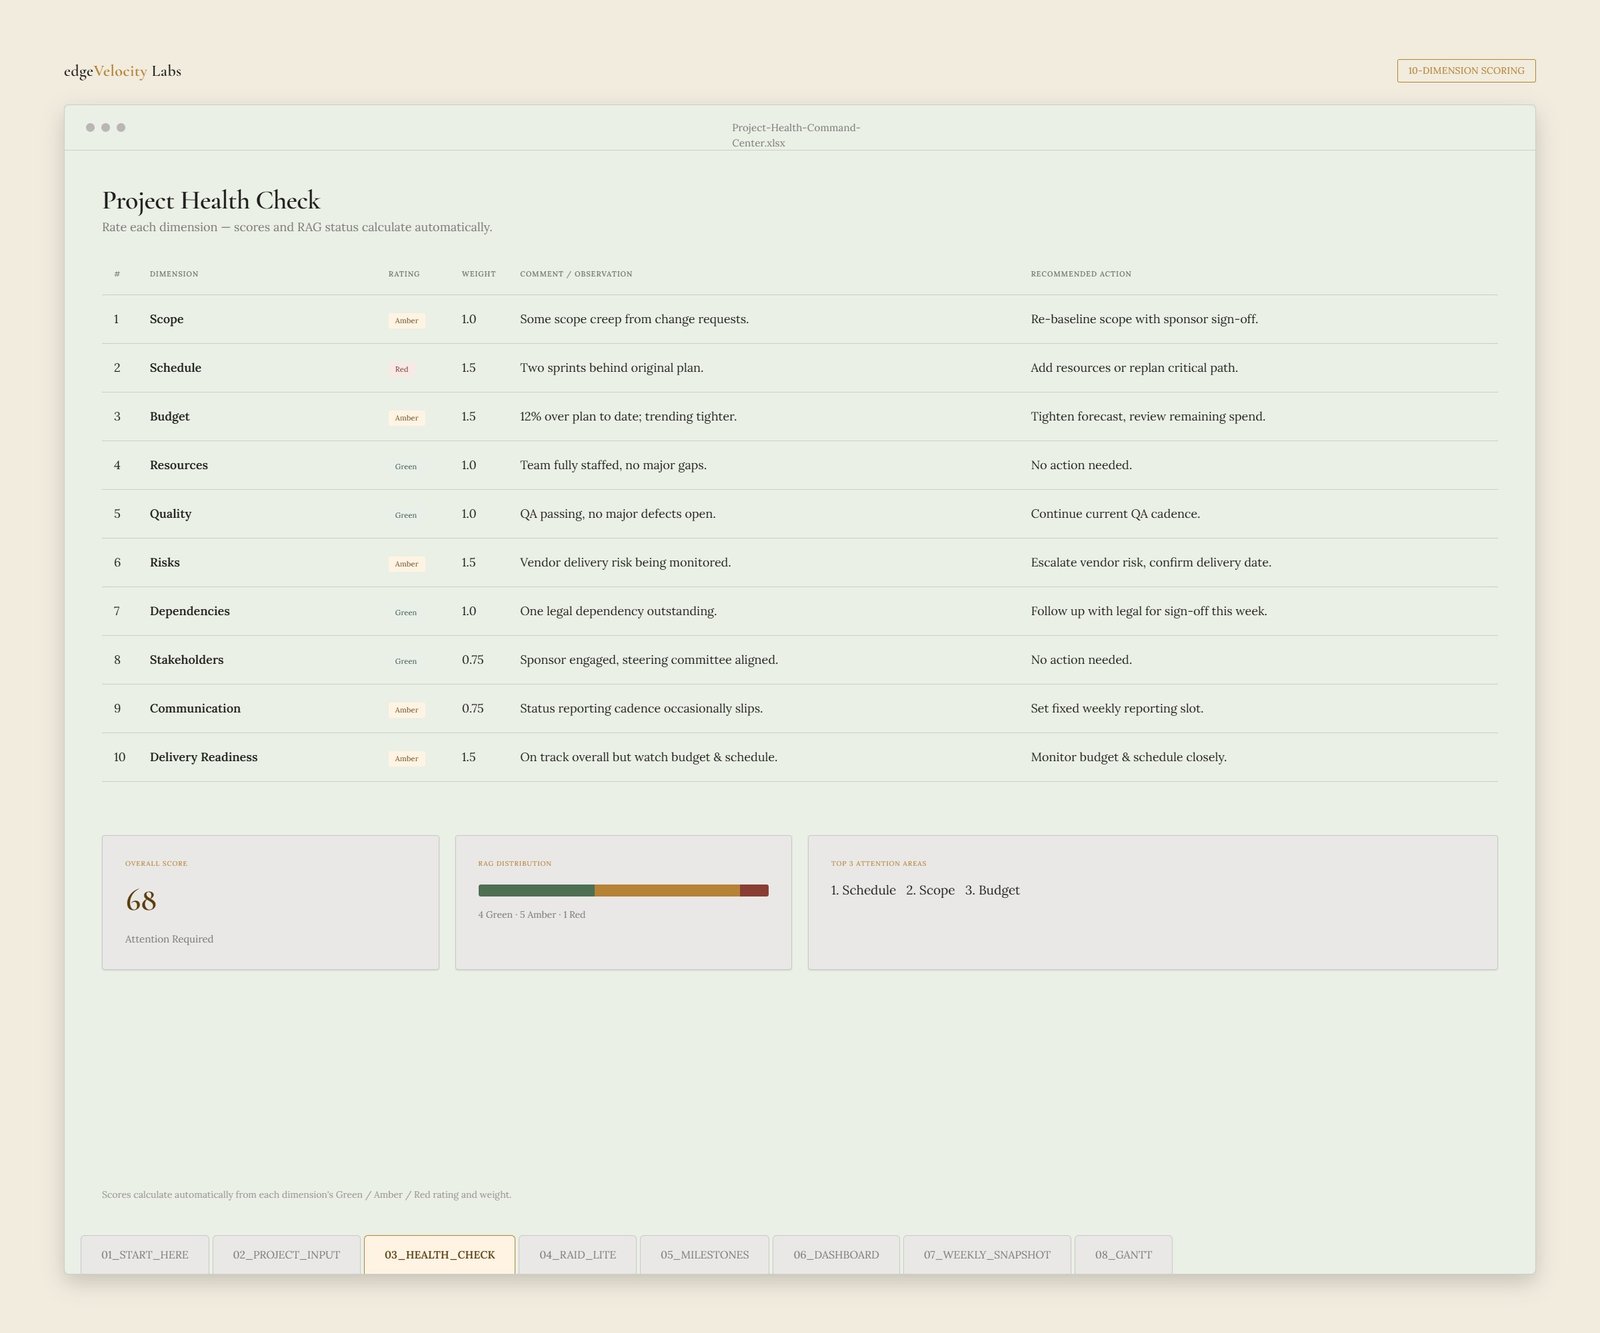
- 03 Health Check — rate 10 weighted dimensions (Scope, Schedule, Budget, Resources, Quality, Risks, Dependencies, Stakeholders, Communication, Delivery Readiness) Green / Amber / Red. Your Overall Health Score, RAG status, and Top 3 Attention Areas calculate automatically — this is the engine behind the whole workbook.
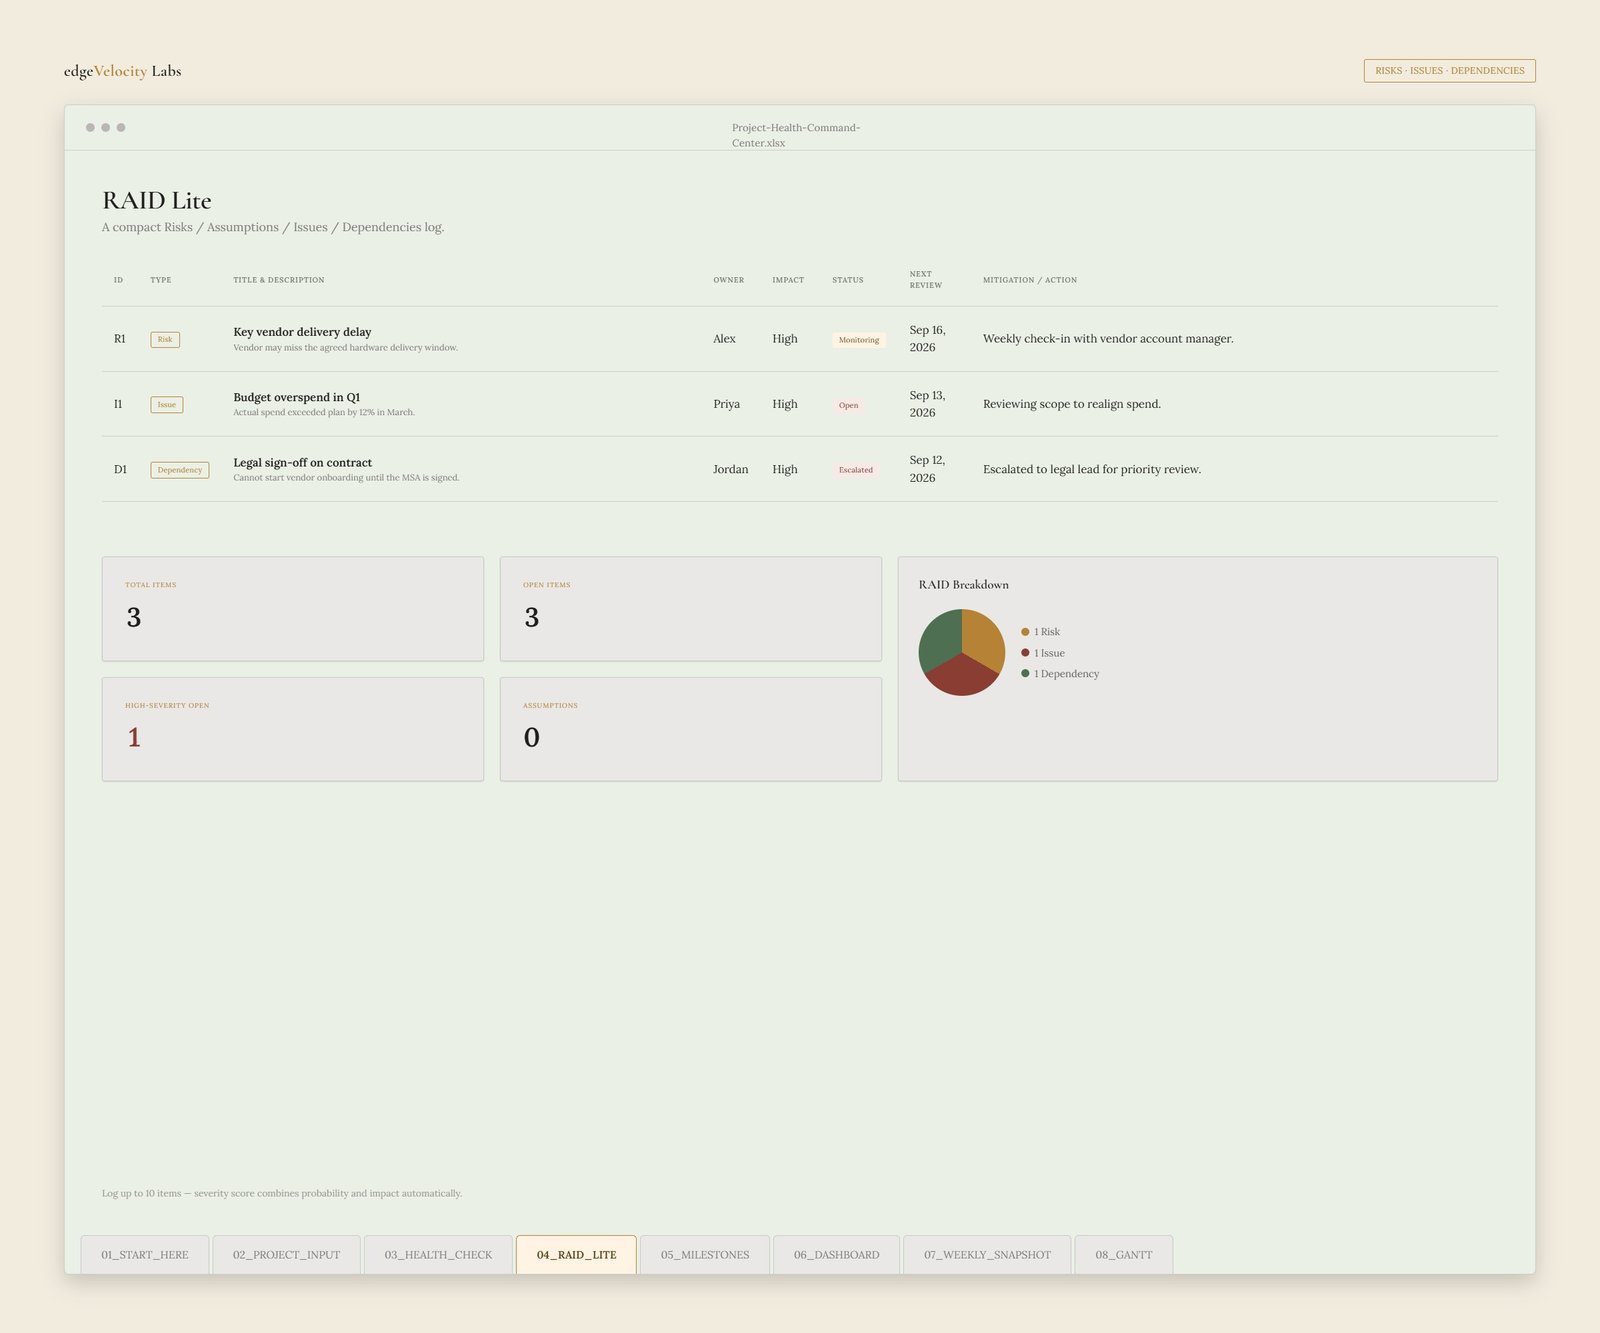
- 04 RAID Log — track Risks, Assumptions, Issues, and Dependencies with an automatic severity score and its own breakdown pie chart.
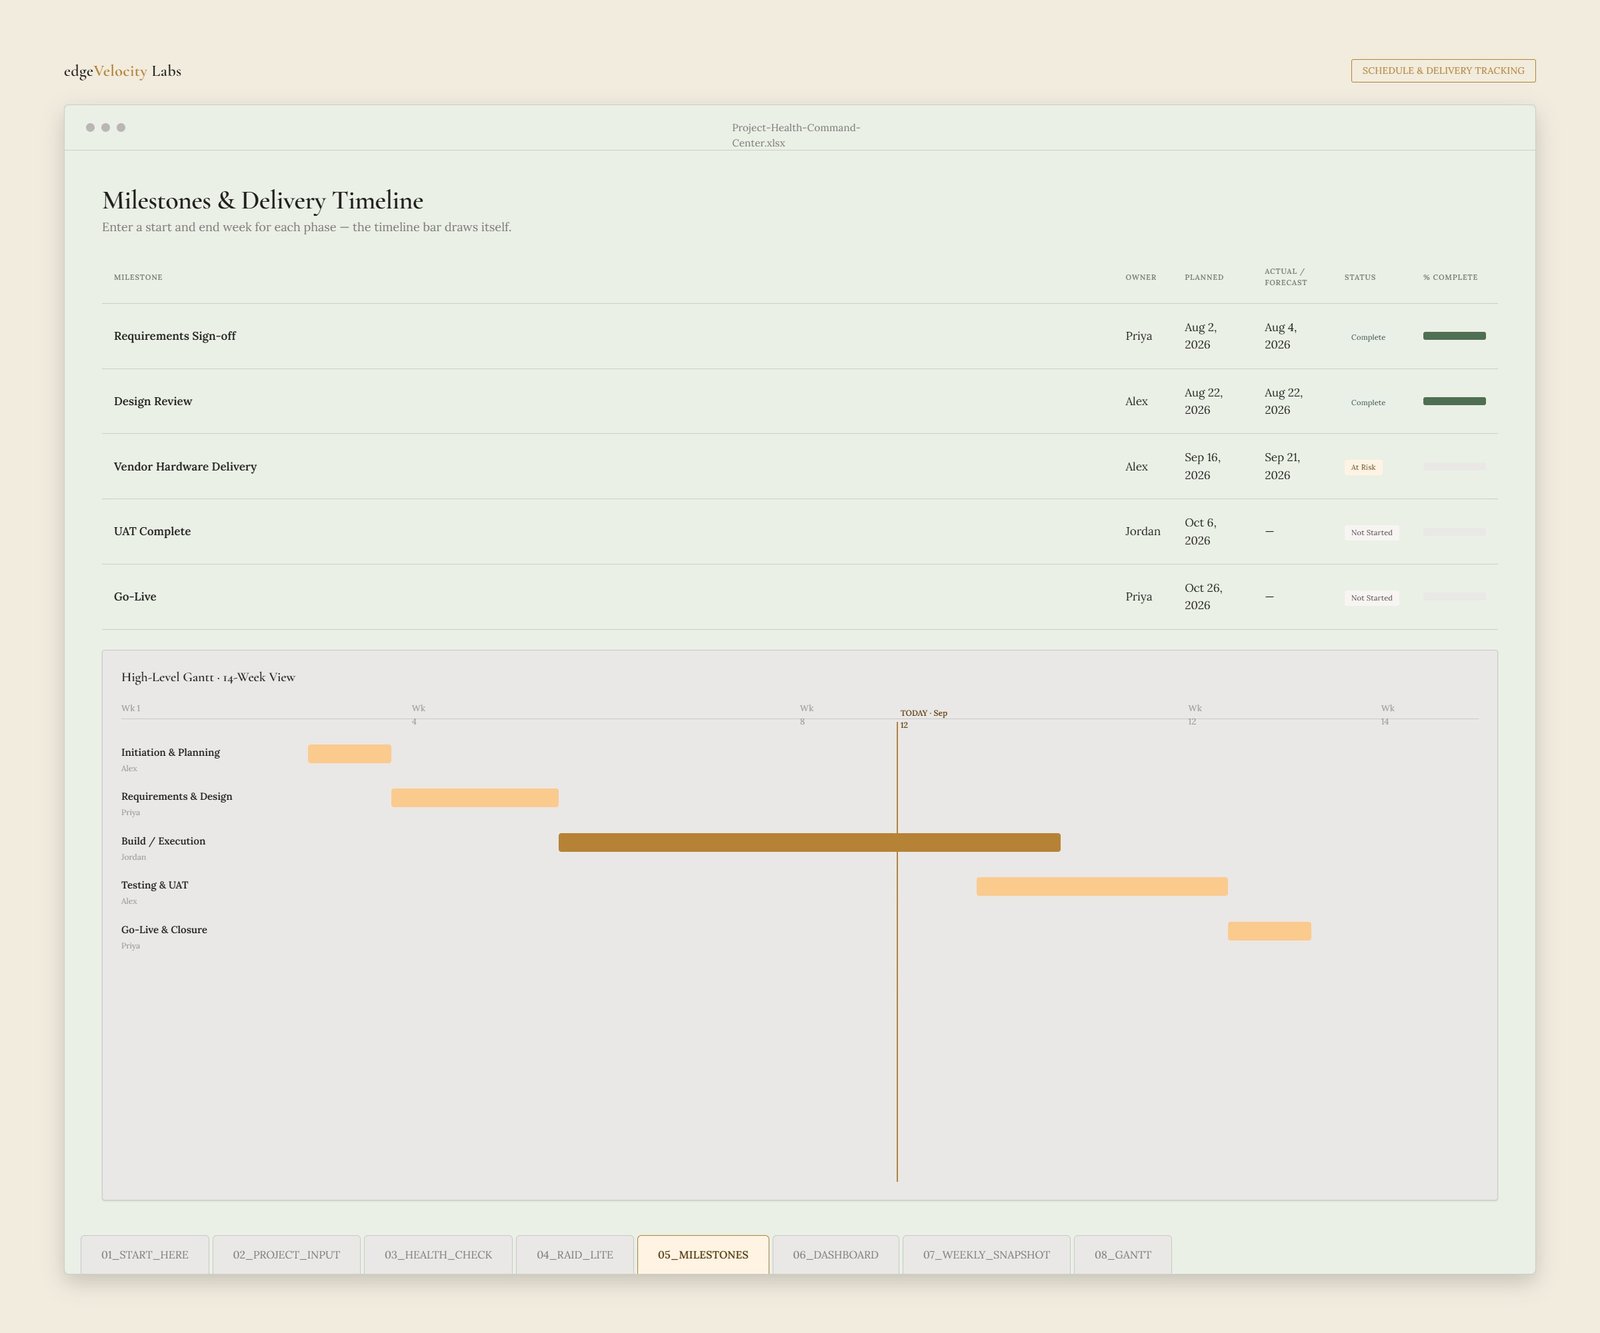
- 05 Milestones — plan key delivery dates and track status (On Track / At Risk / Delayed / Complete), with automatic roll-up counts.
- 06 Dashboard — your one-screen executive view: overall score, RAG status, budget utilization, 5 live charts, and your Top 3 Attention Areas.
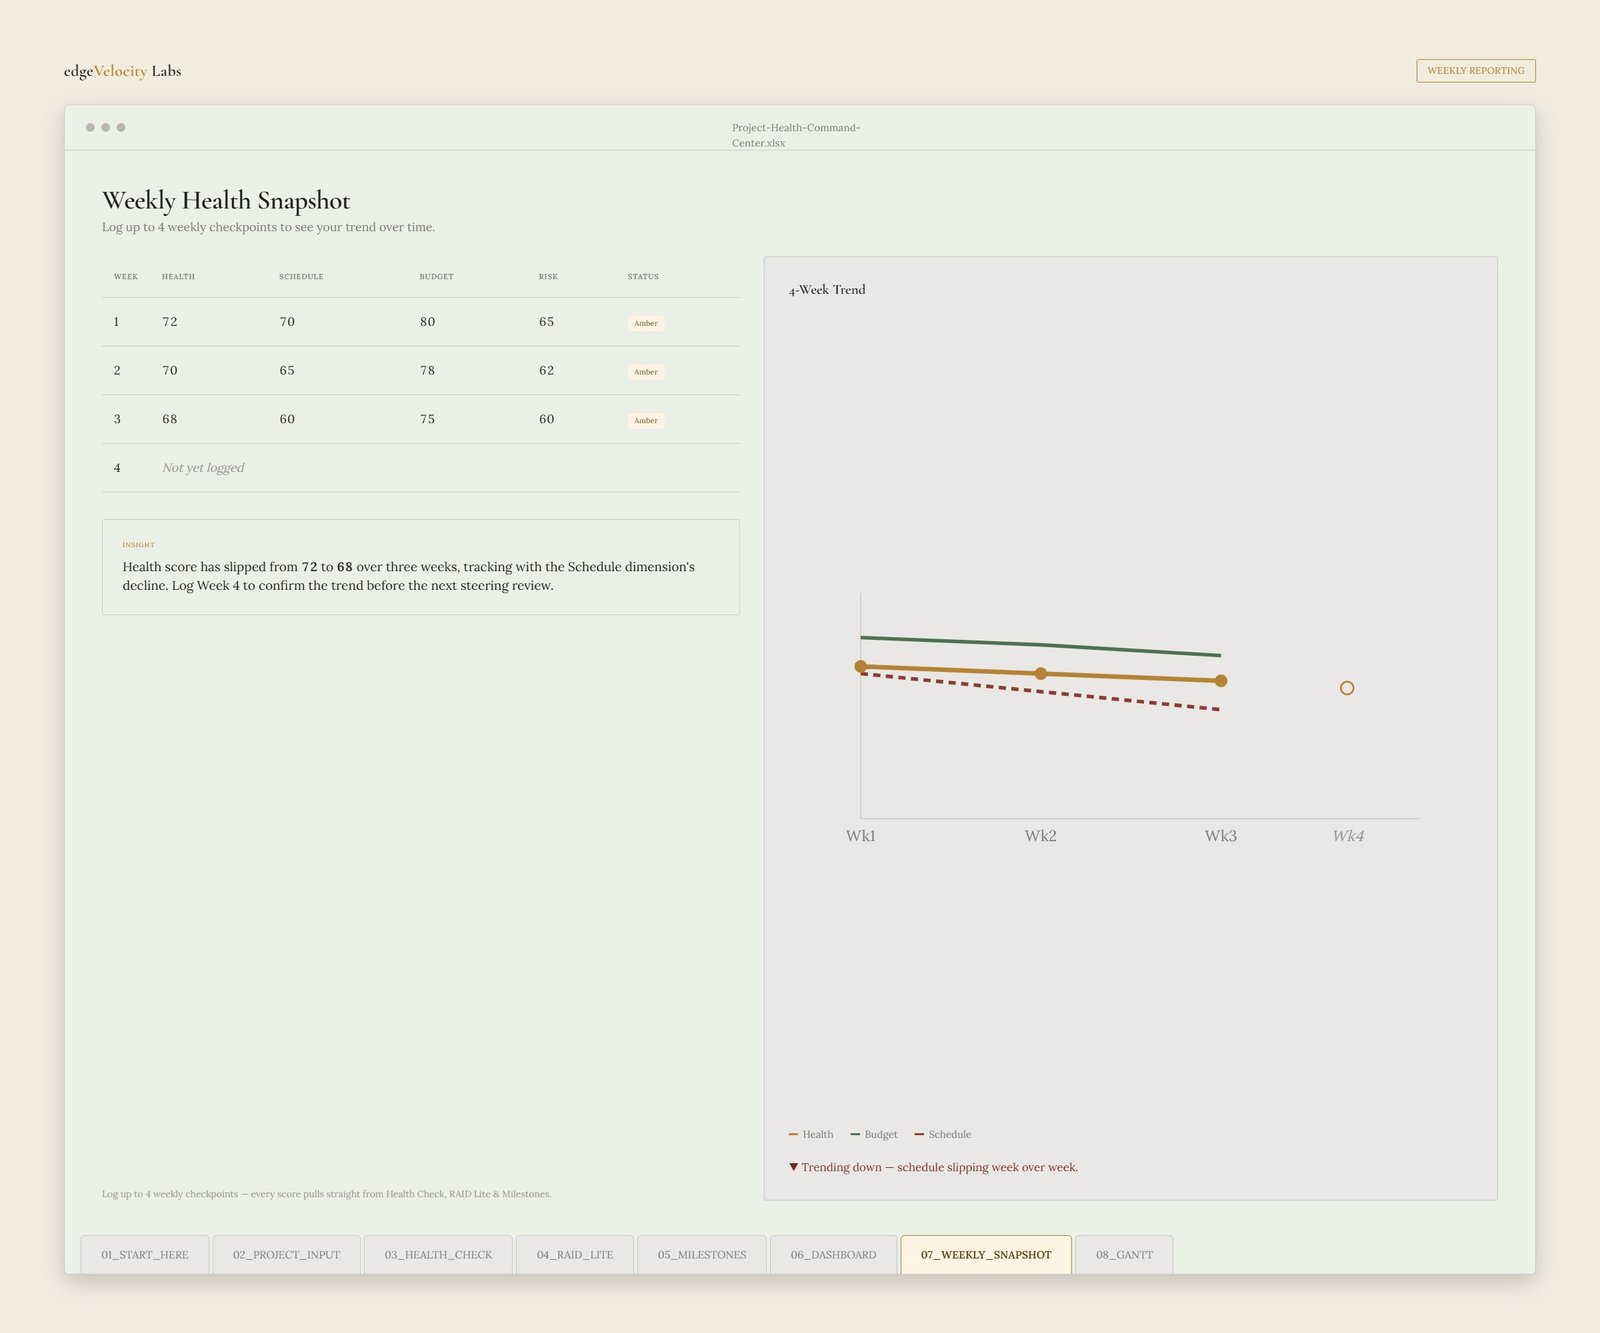
- 07 Weekly Snapshot — log up to 4 weekly checkpoints and watch your health trend line move over time.
- 08 Gantt — a high-level, auto-populating Gantt chart spanning a full year — enter a Start Week and End Week per phase and the timeline bar draws itself.
Works everywhere. Every formula, chart, and conditional format is built to render identically in Microsoft Excel and Google Sheets — no macros, no add-ons, no Apps Script.
See It In Action